Second Quarter Investment Strategy | Narrow and Broad
Rivers offer another example. Narrow and broad rivers can convey the same amount of water, depending on their depth and flow. One river, which delivers nearly 20 percent of the world’s freshwater to the ocean, varies in width from less than one mile to more than 30 miles across. Its name, relevant to today’s market discussion, is the Amazon.
So far this year, leadership in the U.S. stock market has been extraordinarily narrow, with five mega-cap technology powerhouses—Alphabet, Amazon, Meta, Microsoft, and NVIDIA—delivering a full 60 percent of S&P 500 Index returns. Without this quintet, the index would have shown negative returns for the second quarter.
Most market watchers view such a narrow market as less healthy and resilient than more broad-based participation. Yet this small group of stocks has driven markets relentlessly higher.
Since February of last year, the S&P 500 has increased by nearly 40 percent without a single daily decline of 2 percent or greater. As shown in Figure One, this represents the fourth longest period without a 2 percent decline since 1990, and the current period has a higher annualized return than the other three.
Figure One: Trading Days Without a 2 Percent or Greater Decline (1990–June 2024)
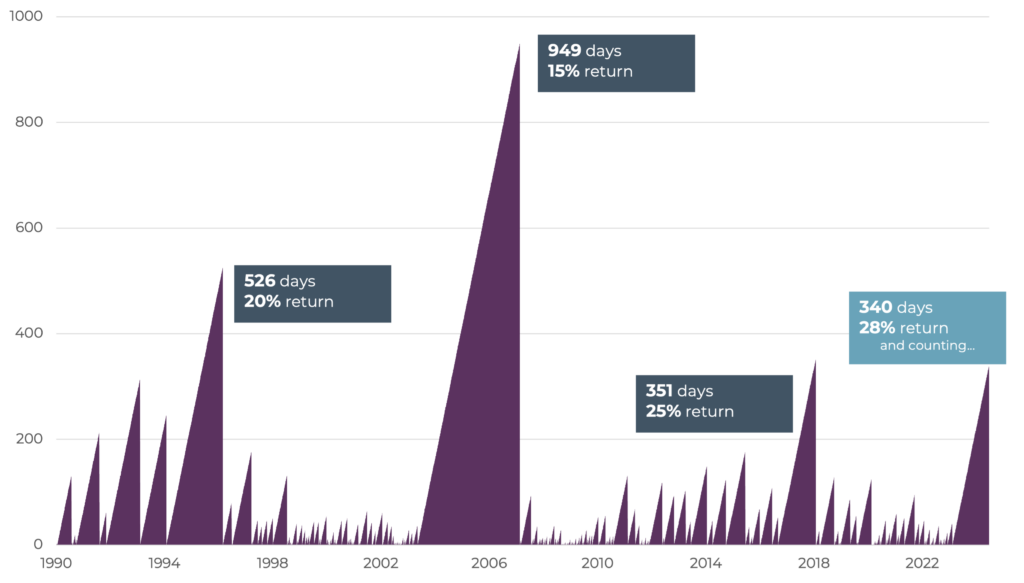
Sources: Morningstar Direct, CAPTRUST Research. Percentage returns are annualized.
Market Rewind: Second Quarter 2024
April began on rocky footing as inflation data came in hotter than expected, quelling hopes for a second-quarter Federal Reserve interest rate cut. That same month, markets also digested escalating Middle East tensions after a volley of attacks between Iran and Israel, causing volatility in stock and energy prices.
However, the markets quickly recovered, as these tensions calmed and a string of data releases suggested the U.S. labor market, consumer spending, and overall economic activity were cooling in an orderly fashion, while corporate earnings remained solid.
U.S. large-cap stocks continued their early-year momentum, with the S&P 500 delivering returns of 4.3 percent and finishing the quarter just shy of a new all-time high. Overall results masked more disparate activity beneath the surface, with more than half of the 11 S&P 500 sectors posting negative returns for the period.
In contrast, small-cap stocks struggled to a 3.3 percent loss as larger companies continued to capture the lion’s share of market gains. Despite continued economic strength, smaller companies have lagged under higher interest rates, due to their tendency to carry higher levels of debt.
Figure Two: Second Quarter 2024 Market Recap
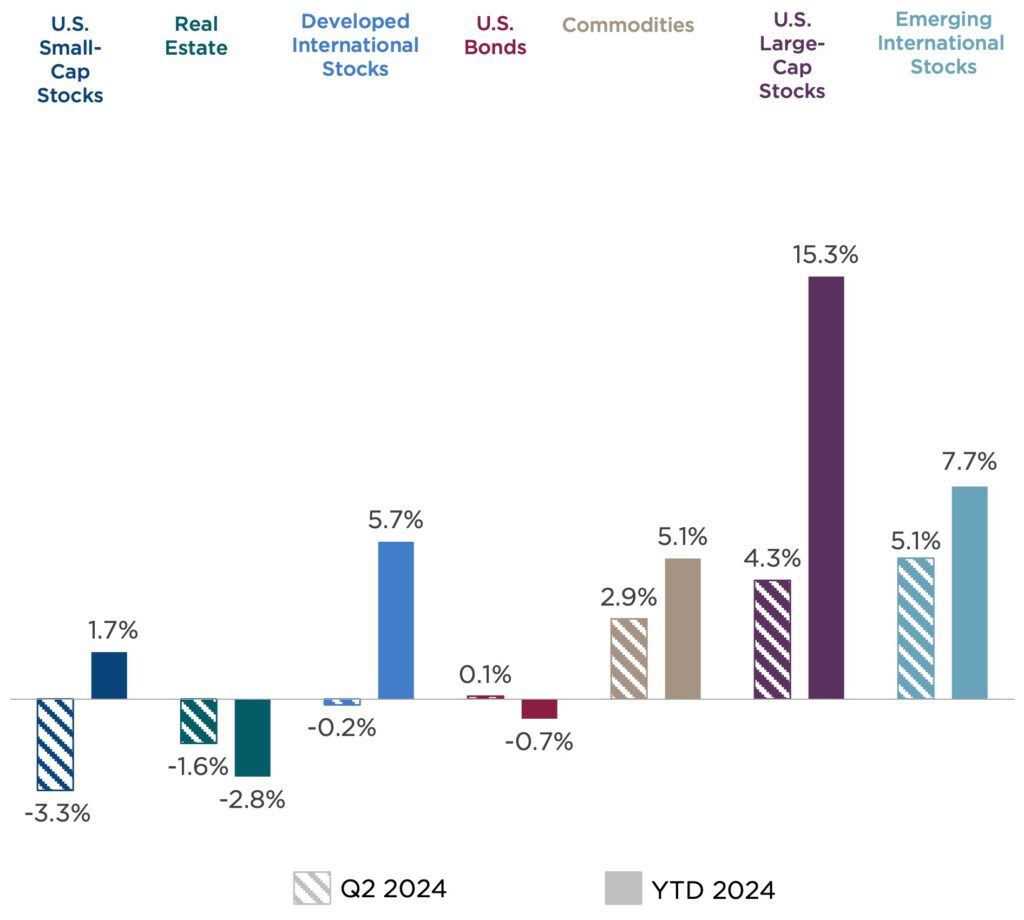
Asset class returns are represented by the following indexes: Bloomberg U.S. Aggregate Bond Index (U.S. bonds), S&P 500 Index (U.S. large-cap stocks), Russell 2000® (U.S. small-cap stocks), MSCI EAFE Index (international developed market stocks), MSCI Emerging Market Index (international emerging market stocks), Dow Jones U.S. Real Estate Index (real estate), and Bloomberg Commodity Index (commodities).
Outside the U.S., performance varied by region. Currency weakness weighed on Japan, and political uncertainty hampered Europe. Emerging market stocks added to their first-quarter gains with a 5.1 percent return in the second quarter. Performance was buoyed by market-friendly actions from Chinese authorities to support the nation’s struggling real estate sector, plus continued strong results from the Taiwanese semiconductor sector.
Interest rate–sensitive segments of the market underperformed, as the yield on the 10-year U.S. Treasury bond climbed from 4.2 to 4.4 percent. Core U.S. bonds sold off in the final week under pressure from rising interest rates, to finish the quarter essentially flat. Credit spreads remained stable for the period. Real estate showed a modest loss of 1.6 percent.
Commodities were volatile as energy prices, particularly oil prices, experienced swings due to geopolitical tensions and production adjustments by major exporters. Precious and industrial metal prices advanced, especially gold, silver, and copper, while agricultural commodities lagged.
Broad Perspectives on Narrow Market Leadership
The narrowness or breadth of various economic and market conditions can provide important clues to their strength or fragility. Today, we see narrow conditions not just within the stock market but also in key areas such as consumer behavior, inflation drivers, and election outcomes. These factors carry important implications for the future direction of the economy and markets.
When a smaller group of companies drives overall index performance, that index can become increasingly top heavy. As shown in Figure Three, the 10 largest companies in the S&P 500 now represent 36 percent of the index—the highest degree of concentration since the 1970s.
Figure Three: Total Weight of the Top 10 Stocks in the S&P 500 Index
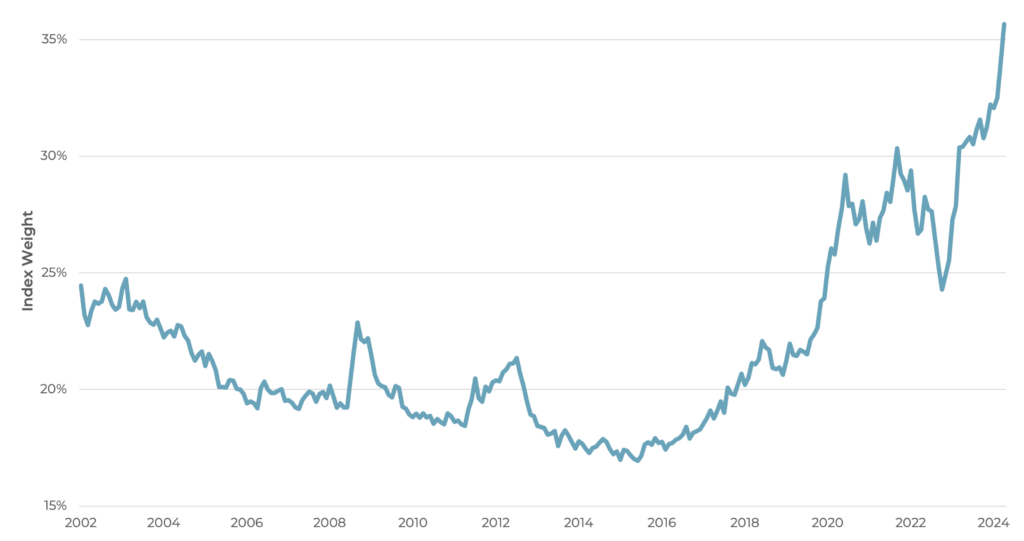
Sources: Morningstar Direct, CAPTRUST Research
To put this in perspective, Microsoft—the highest-weighted stock in the S&P 500—currently has a market capitalization of more than $3.4 trillion, which is nearly 100 times larger than that of the median stock. The level of concentration in these top stocks has now reached a multi-decade record, far higher than what the markets witnessed during the height of the dot-com bubble.
Optimists argue that this degree of concentration should not be concerning, because it demonstrates the exceptional growth, durability, and sheer earnings power of these few companies. It also reflects their ability to navigate the high interest rates, inflationary pressures, and geopolitical uncertainty of the past few years better than their peers.
However, others view this degree of concentration as a sign of market vulnerability. The combination of a narrow market and high valuations increases concerns about the potential for a correction (a decline of 10 percent or more from recent highs) if these companies fail to deliver on lofty earnings growth expectations.
Although analysts now expect earnings growth will stretch across a much larger swath of the equity markets in the second half of 2024 and in 2025, any such expansion of market strength is likely to depend on lower interest rates.
Narrowing Consumer Strength
Consumer spending is the single largest component of U.S. economic activity. The consumer’s ability and willingness to spend during and after the COVID-19 pandemic has, in large measure, prevented a significant economic slowdown, despite high inflation and restrictive monetary policy. Now, it seems consumers could be losing steam.
Recent retail sales data suggests cooling spending activity. Inflation-adjusted retail sales for the April to May period fell by 1.2 percent compared to the first quarter of 2024, with spending on goods showing particular weakness. Other discretionary categories such as food services and drinking places have fallen for three of the past five months. Despite positive movement in some areas, such as automotive-related sales, the overall picture points toward more cautious consumer behavior. [1]
Another place where consumer stresses are becoming evident is in credit utilization. Total credit card balances have now eclipsed $1.1 trillion, while the average interest rates for accounts carrying a balance have risen above 22 percent. Nearly one in five credit card users have maxed out their available credit. Delinquency rates for both auto loans and credit cards have surpassed their 2019 levels by 15 percent and 28 percent, respectively. [2]
A likely contributor to credit card stress is the depletion of savings accumulated during the pandemic. One frequently cited pillar of consumer strength over the past four years is the surplus of savings built up throughout the pandemic, partly due to substantial government stimulus payments.
Now, this savings cushion is narrowing. As usual, the greatest stress is being felt by those with the lowest incomes, as household budgets are squeezed by rising prices, high interest rates, and climbing rent payments. Levels of consumer sentiment for the lowest third of earners is far below that of middle and high earners. And, as shown in Figure Four, while higher-income households continue to maintain a cushion of excess savings, the level of inflation-adjusted liquid assets for the bottom 20 percent of earners has deteriorated since 2019. [3]
Figure Four: Changes in Real Household Liquid Assets
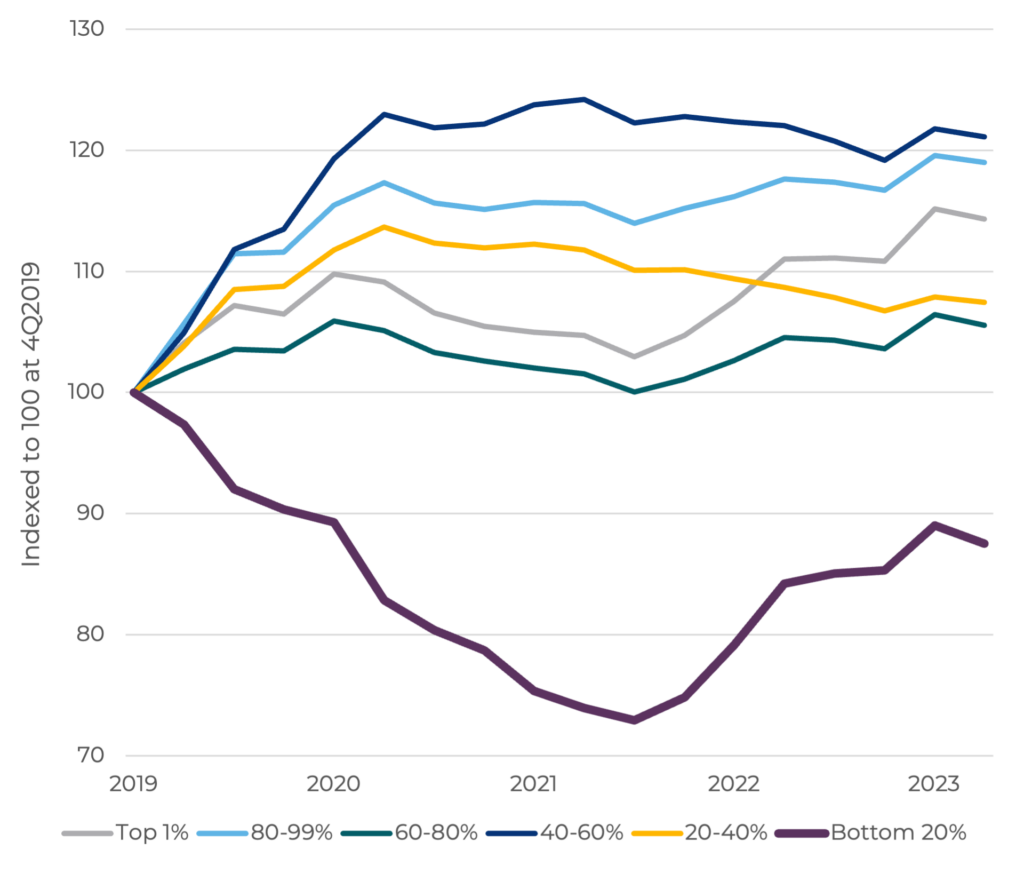
Sources: Board of Governors of the Federal Reserve System, U.S. Bureau of Economic Analysis, CAPTRUST Research
Despite these warning signs, the strong labor market remains a powerful tailwind for consumer activity. The ability to find and keep a job that pays wages that grow faster than inflation plays a pivotal role in supporting consumer confidence and activity.
While the unemployment rate rose slightly in June, its level of 4.1 percent is still far below the 40-year average of 5.8 percent. The labor force participation rate among prime-age workers (those between ages 25 and 54) has also risen to a two-decade high, helping offset the surge of early retirements witnessed during the pandemic. And the number of job vacancies per unemployed worker remains at 1.2, matching its pre-pandemic level. [4]
Narrowing Inflation Drivers
Following 2022’s inflation spike, which saw the consumer price index (CPI) rise to a four-decade high of 9 percent, there has been a substantial cooling in price pressures. In May, inflation was lower than expected at 3.3 percent on a year-over-year basis. This was the smallest monthly gain for more than two years. Although there is still some distance to cover before reaching the Fed’s 2 percent inflation target, continuing signs of declining inflation sustain hopes that the Fed could deliver its first rate cut later this year.
Another positive sign is that the number of categories showing more than 2 percent inflation within the basket of goods and services used to calculate CPI continues to narrow. At its peak in 2022, virtually all major categories of goods and services exceeded the Fed’s 2 percent target. As Figure Five shows, the number of categories exceeding this threshold has steadily declined since. Several essential categories, including shelter and medical care, which tend to carry higher weights within the CPI, continue to hold inflation above target. Others, including new and used vehicles and airfares, have fallen considerably. This indicates that inflation in those categories is likely due to specific factors, rather than broad-based price pressures—a positive sign that inflation is not firmly entrenched.
Figure Five: Number of Core CPI Categories with Inflation Greater than 2 Percent (Year Over Year)
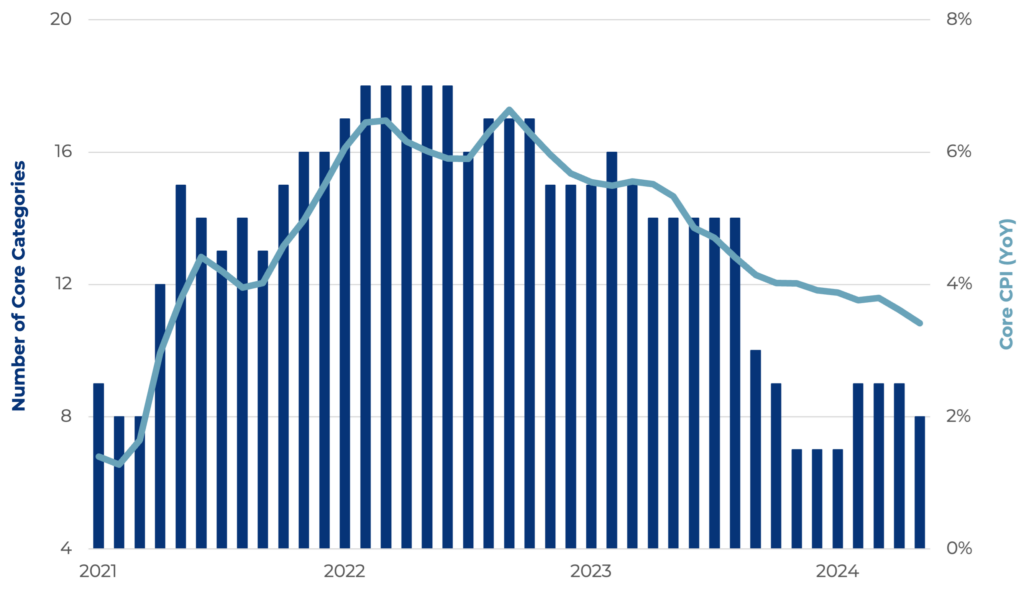
Sources: U.S. Bureau of Labor Statistics, CAPTRUST Research
Another positive sign is that the magnitude of price increases has subsided. At the peak, prices of essential items such as dairy were up more than 20 percent from the prior year. Today, the rate of change in this category has fallen to just 1 percent.
A Narrow Election
Historically, presidential election years have seen solid investment returns. This is especially true in years when an incumbent is running for reelection, as administrations are motivated to use government tools to maintain economic strength. Over the past 50 years, election years with a running incumbent have seen S&P 500 returns of more than 17 percent on average.
History also tells us that markets can thrive under any division of government. Markets performed well under both of the current presidential candidates’ previous terms.
However, rarely have the policy differences between candidates been so great—from international relations, tariffs, and deglobalization, to tax, energy, and regulatory policy. It was already shaping up to be a close and unpredictable election, even before the attempted assassination of former President Trump on July 13. This horrific event will change the dynamic of the race in unpredictable ways, and there will likely be many more twists and turns between now and November.
Control of Congress is also paramount for either party to fulfill its agenda. This is important given the significant fiscal policy imperatives on the legislative docket in 2025. The debt ceiling extension passed in June of this year is set to expire on January 1, 2025, which will require Congress to return to the negotiation table. More than $4 trillion of tax provisions are also set to expire next year, without an extension.
Regardless of who wins the presidential election, they will inherit a fraught federal budget when they take office. Due to ballooning government debt in the post-pandemic era, plus the high interest rate environment, the interest expense on federal debt has nearly doubled over the past three years.
Interest expense on government debt now exceeds defense spending as a share of the federal budget. This represents a potential risk to investors if neither candidate or party is able to enact fiscal reform. Continued deterioration of the fiscal situation could translate to higher bond market volatility due to changing supply and demand dynamics for Treasury bonds.
So far, markets have remained calm amid the dramatic events of this early election season. Although presidential election years generate abundant headlines, they typically have a more muted effect on markets. Nevertheless, given the substantive differences between the candidates’ policy priorities, it is likely that election uncertainty will eventually make its way into markets. When or if the odds of the election become clearer, industries that are connected to the policy preferences of the candidates and parties are likely to react, particularly around the energy and financial sectors.
Broad Possibilities
At this halfway point of the year, the financial markets have delivered a broad range of results—from exceptional returns for U.S. large-cap and international equities to disappointing outcomes for more interest rate–sensitive categories such as small-cap stocks, bonds, and real estate. Corporate earnings have been robust among the largest companies, but this growth must broaden to return the market to a more balanced position.
Although investing always involves uncertainty, investors prefer unknowns that they can analyze and discount. The remainder of the year will present challenges that are less fundamental in nature, and therefore perhaps more troubling to markets: the outcome of a narrow election season, the actions of Fed policymakers, the unknown impacts of emerging technology, and significant geopolitical risks.
While investors should be alert to these risks and the potential for changing conditions, they should also recognize that change often creates new opportunities.
[1] “Retail Sales Confirm Continued Consumer Spending Pullback,” The Conference Board
[2] New York Fed Consumer Credit Panel/Equifax, Board of Governors of the Federal Reserve System, CAPTRUST Research
[3] Surveys of Consumers, University of Michigan
[4] Bureau of Labor Statistics, CAPTRUST Research