Never Say Never
History is full of examples of things that weren’t supposed to happen but did—and, likewise, things that seemed certain to happen but never came to life. These events cause us to reexamine our view of what’s possible. Examples include the sinking of the unsinkable Titanic, the mapping of the complete human genome, and the invention of human flight. Each of these events and achievements changed the way we viewed the world and, therefore, changed the world itself.
There are many such nevers associated with the stock market and the economy. And there are an equivalent number of always statements. These heuristics suggest that specific economic conditions never or always accompany specific market reactions. For some, these assumptions feel like laws of nature. However, the economy and financial markets are anything but predictable. Investors should never take never or always for granted.
Continued Resilience
Amid continuing questions about the health of the economy and the likelihood and severity of a recession, the second quarter of 2023 delivered another strong financial market performance. As we pass the midpoint of the year, investors remain bullish that the economy can push through a growth slowdown and achieve a soft landing, avoiding a more serious recession.
One of the noteworthy narratives this quarter has been the resurgence of big tech stocks, a rally of which drove the NASDAQ Composite Index to its best-ever first half of the year. These companies rode a wave of investor enthusiasm for artificial intelligence (AI) applications, with the potential to unleash business productivity and increase global output.
Within large-cap U.S. equity markets, mega-cap technology stocks, including Apple, Microsoft, Meta, and Nvidia, led substantial market advances. So far this year, the S&P 500 Index has seen an impressive rise of almost 17 percent. However, the typical stock in the S&P 500, when equally weighted, posted a comparatively lower but still healthy 7 percent gain.
Meanwhile, according to Factset Earnings Insight, corporate earnings slid roughly 7 percent, representing the largest earnings decline since the third quarter of 2020. The result is that large-cap U.S. equity valuations have reached the highest—or least attractive—quartile of their 10-year historical range. This could be a sign of overextended investor optimism.
Small-cap stocks delivered more muted returns of 5.2 percent for the quarter, raising their year-to-date return to 8.1 percent. This dichotomy between large- and small-cap stocks is driven largely by the subpar performance of the financial, utility, and real estate sectors throughout the year.
While equity investors have cheered the country’s economic resilience, bond investors have been forced to raise their interest rate expectations, putting downward pressure on bond prices and more than offsetting their higher underlying yields. As a result, we saw a modest loss of less than 1 percent for core bonds during the quarter, bringing their year-to-date returns to 2.1 percent.
Outside the U.S., developed equity markets across Europe and in Japan enjoyed strong absolute results so far in 2023. However, their emerging market counterparts have underperformed, weighed down by disappointing economic activity within China.
Despite a modest gain for the year, real estate uncertainty remains high, especially across the office and retail sectors. Higher mortgage rates and tighter bank lending standards have also contributed to weakness.
Commodities posted their second consecutive quarterly decline, with both oil and precious metals prices sliding during the second quarter.
Figure One: Second Quarter and Year-to-Date for Asset Classes
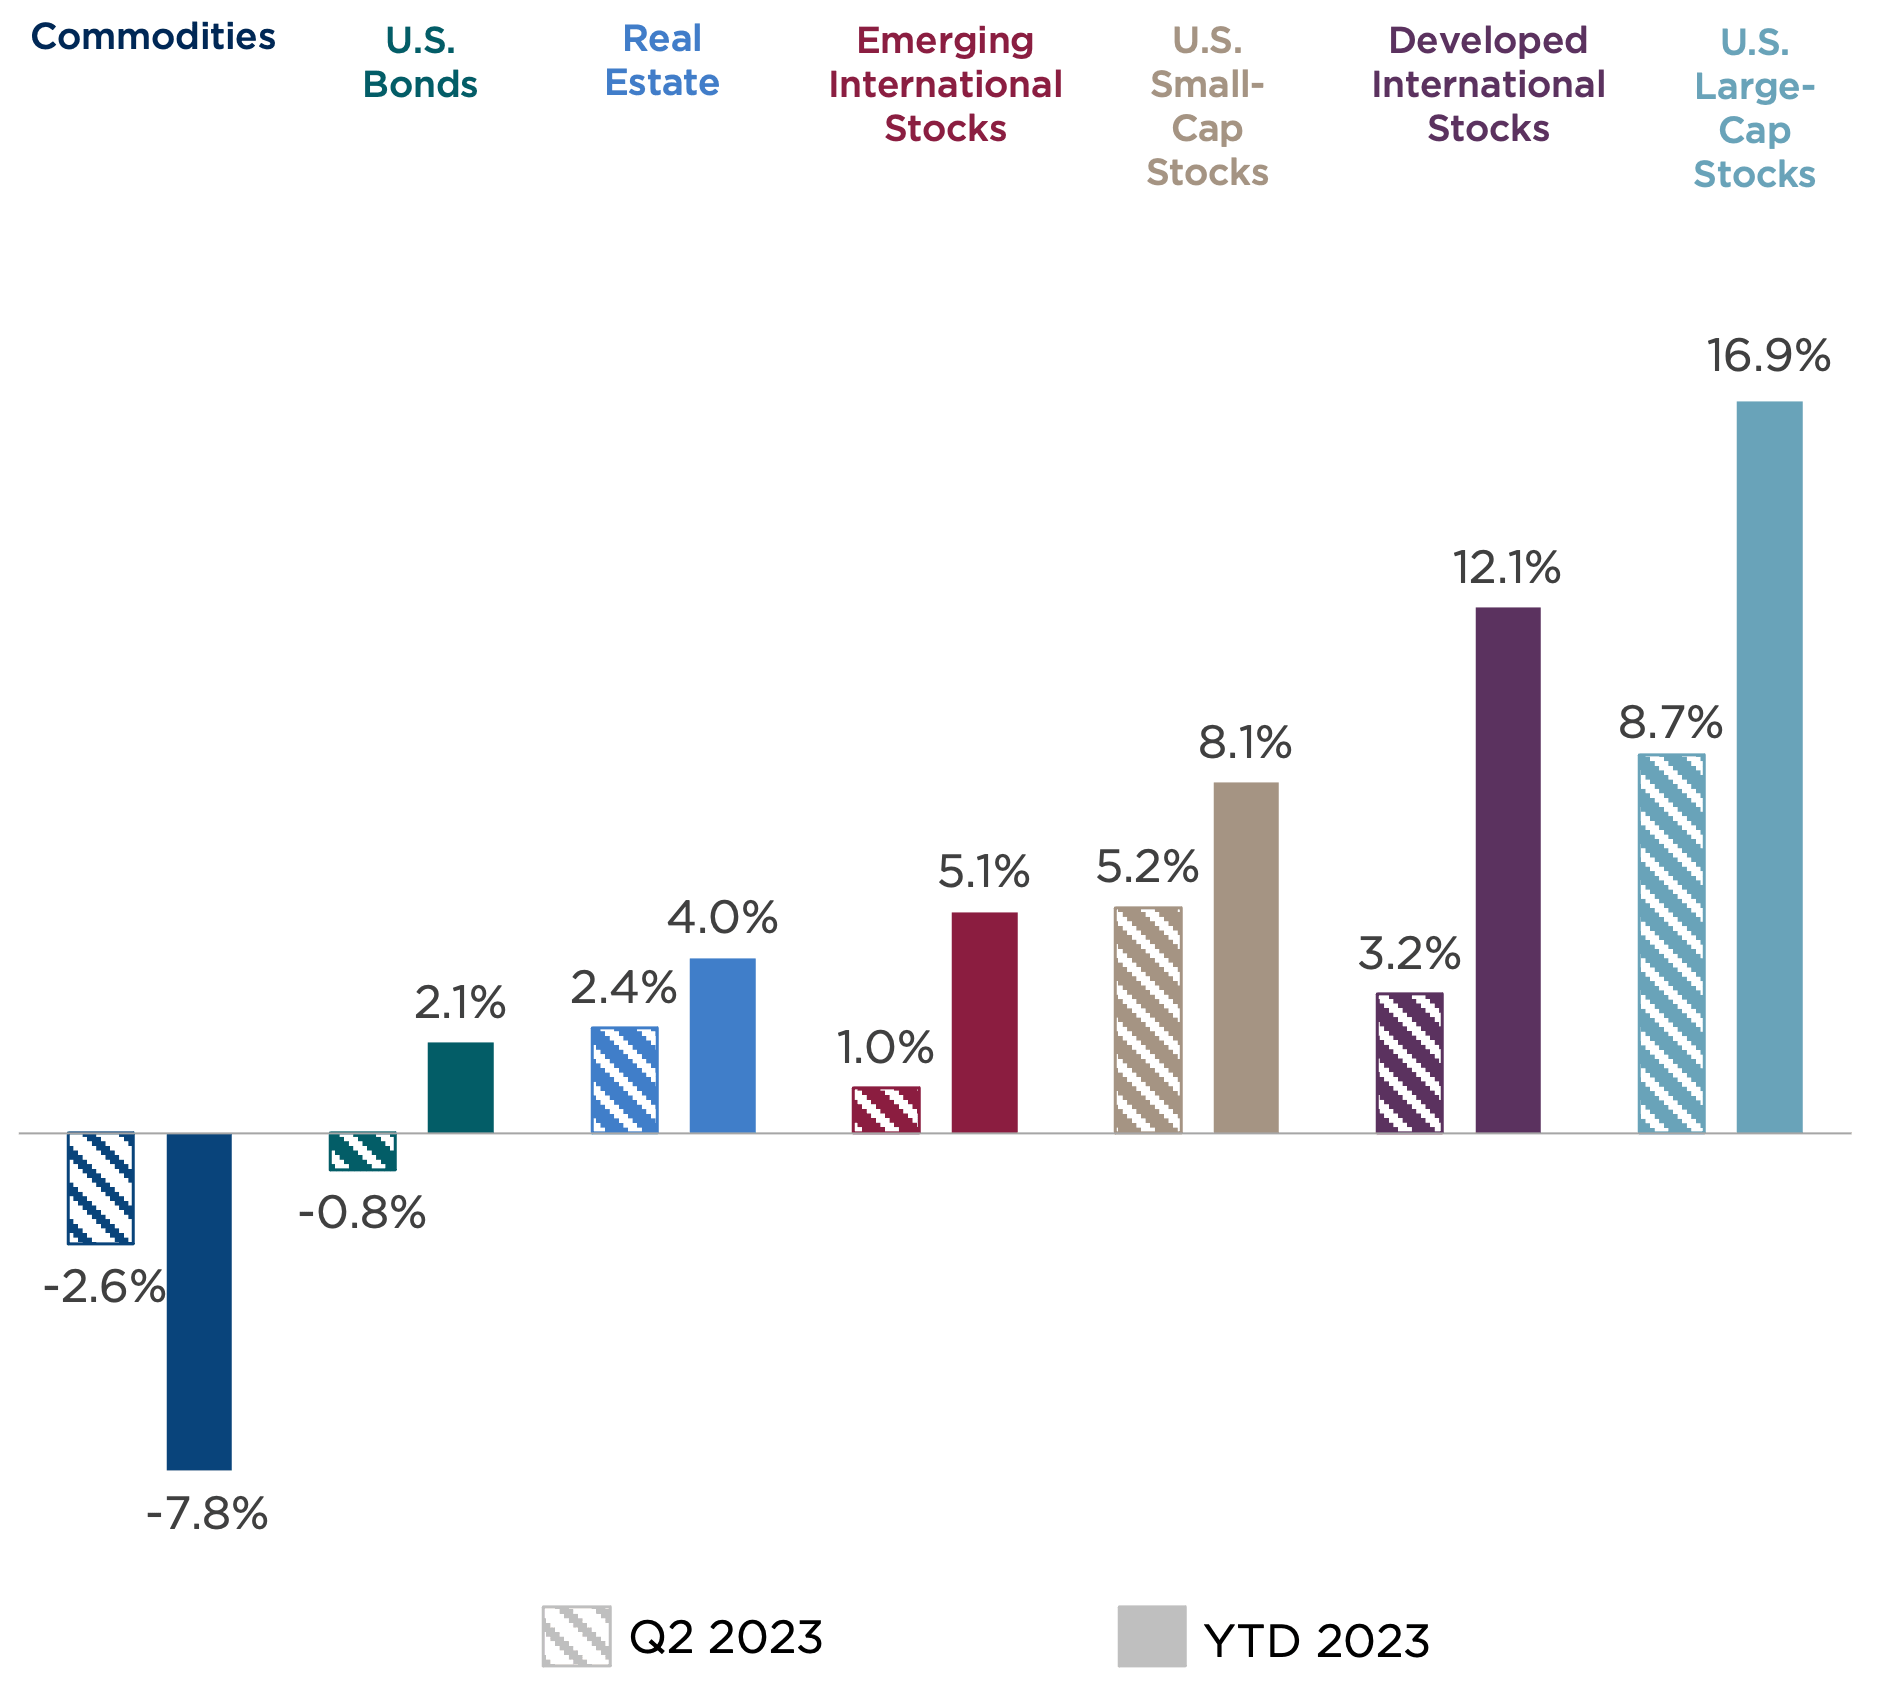
Source: CAPTRUST Research
Nevers and Always
So far this year, the economy has defied widespread anticipation for a recession, continuing its steady growth march instead. Investors are left scratching their heads at the swirling mix of opposing data. In this environment, it’s only human to defer to shortcuts and heuristics to help make sense of the world. Analysts are prone to search for data points that support their preformed opinions, and for financial pundits, this means relying on a healthy dose of nevers and always.
The charts below summarize some three common never shortcuts and three common always shortcuts that have been applied to recessions over the past 50 years and where these indicators stand today.
Three Common Never Shortcuts
1. The U.S. has never entered a recession with an unemployment rate lower than 4 percent.
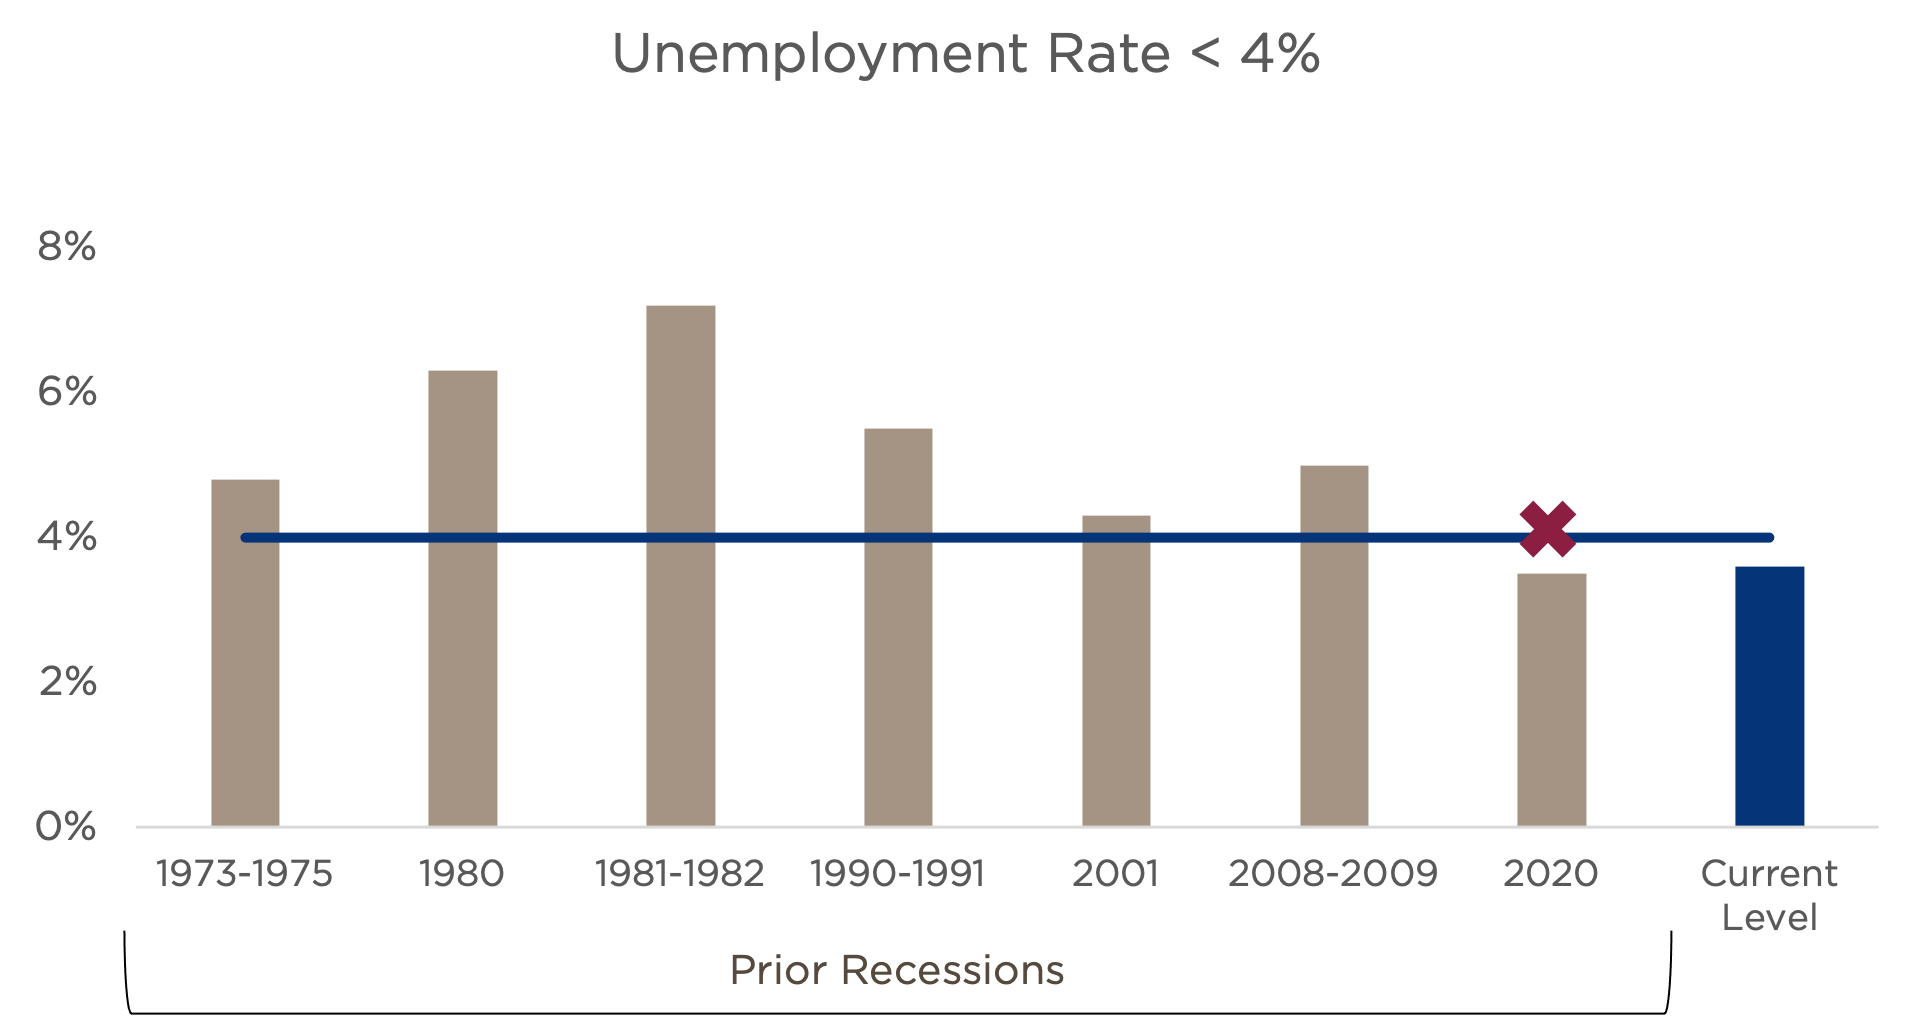
Sources: U.S. Bureau of Labor Statistics, Federal Reserve Bank of St. Louis
A healthy labor market is a precursor to a strong economy. Plentiful jobs and strong but stable wage growth give consumers the confidence and ability to spend. Currently, unemployment is low, and spending is strong.
2. The economy has never entered a recession when at least three National Bureau of Economic Research (NBER) economic indicators rise.
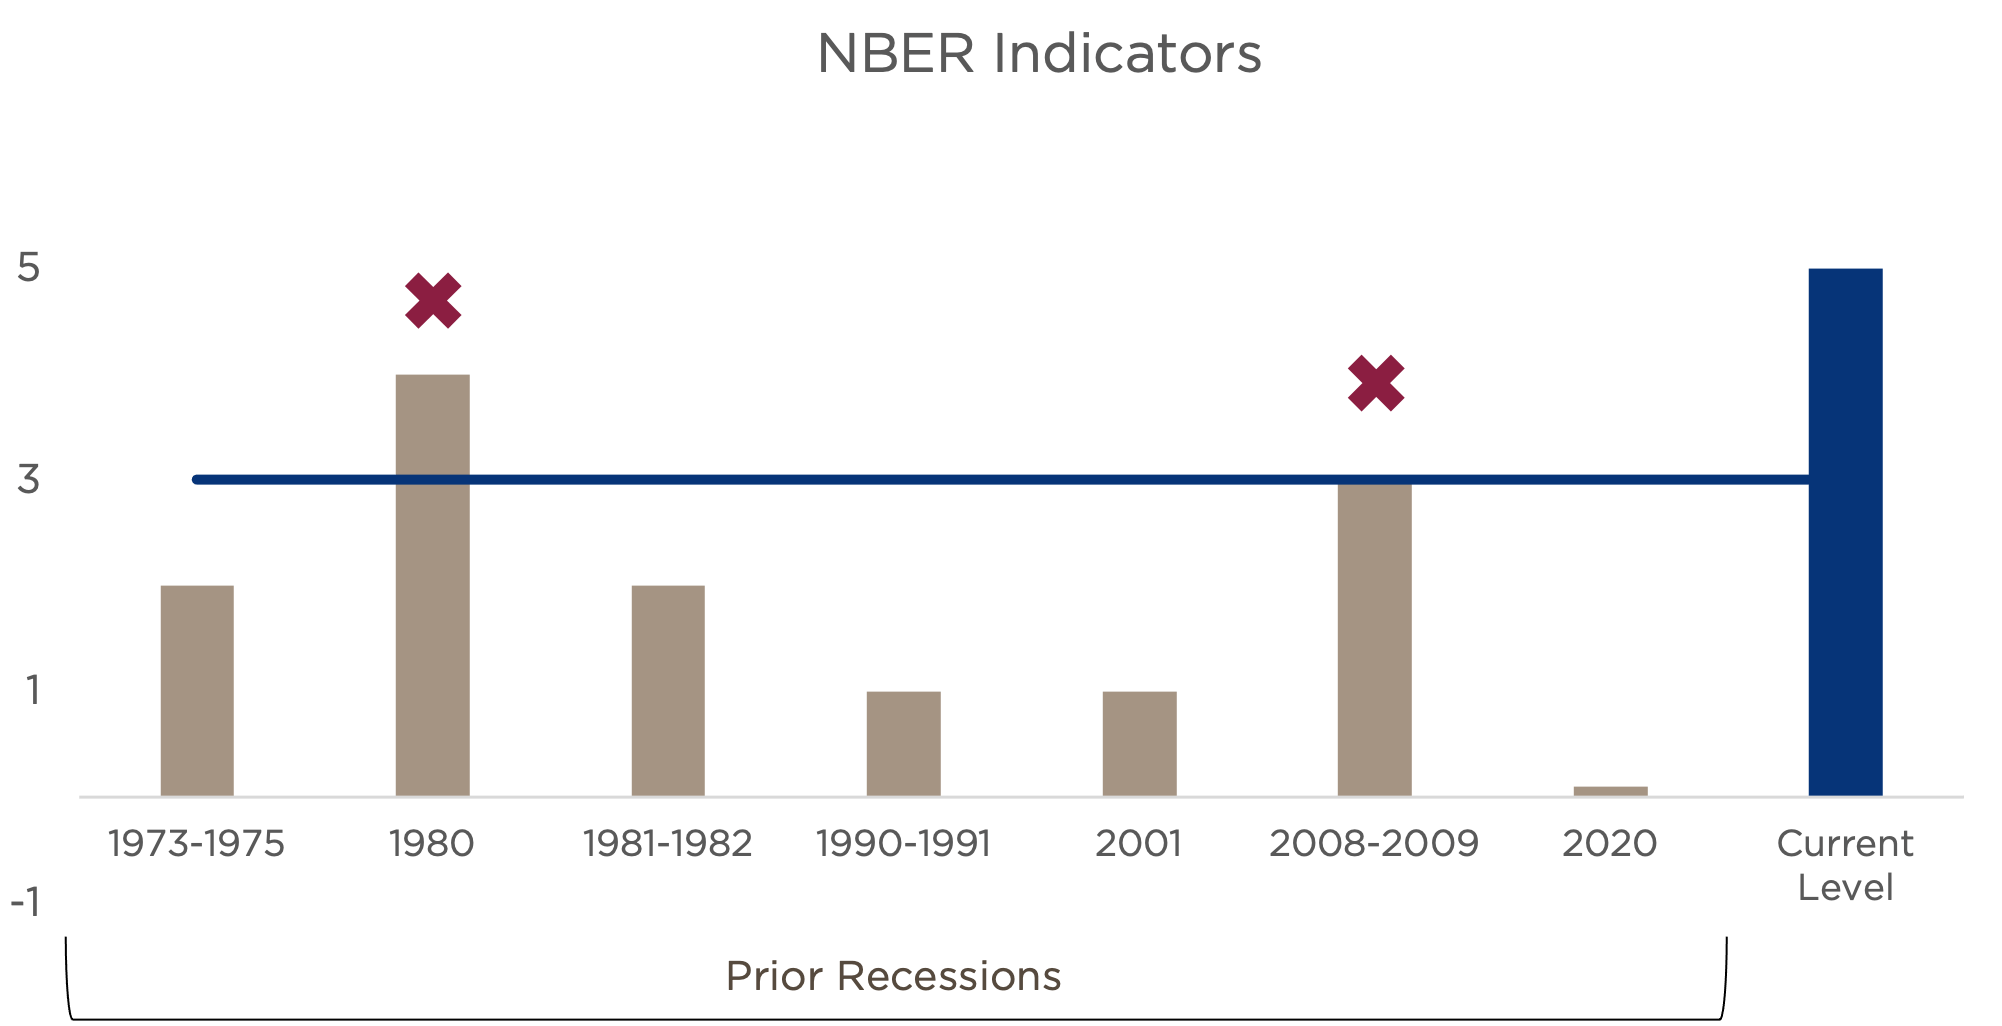
Sources: National Bureau of Economic Research, Federal Reserve Bank of St. Louis
The NBER is the organization that officially defines the start and end dates of recessions, so it is typically a good idea to follow its indicators. There are five NBER indicators, and rising levels indicate economic strength. Current levels reflect strong economic fundamentals.
3. A recession has never occurred without the credit spreads of bonds at the low end of investment grade exceeding 2 percent.
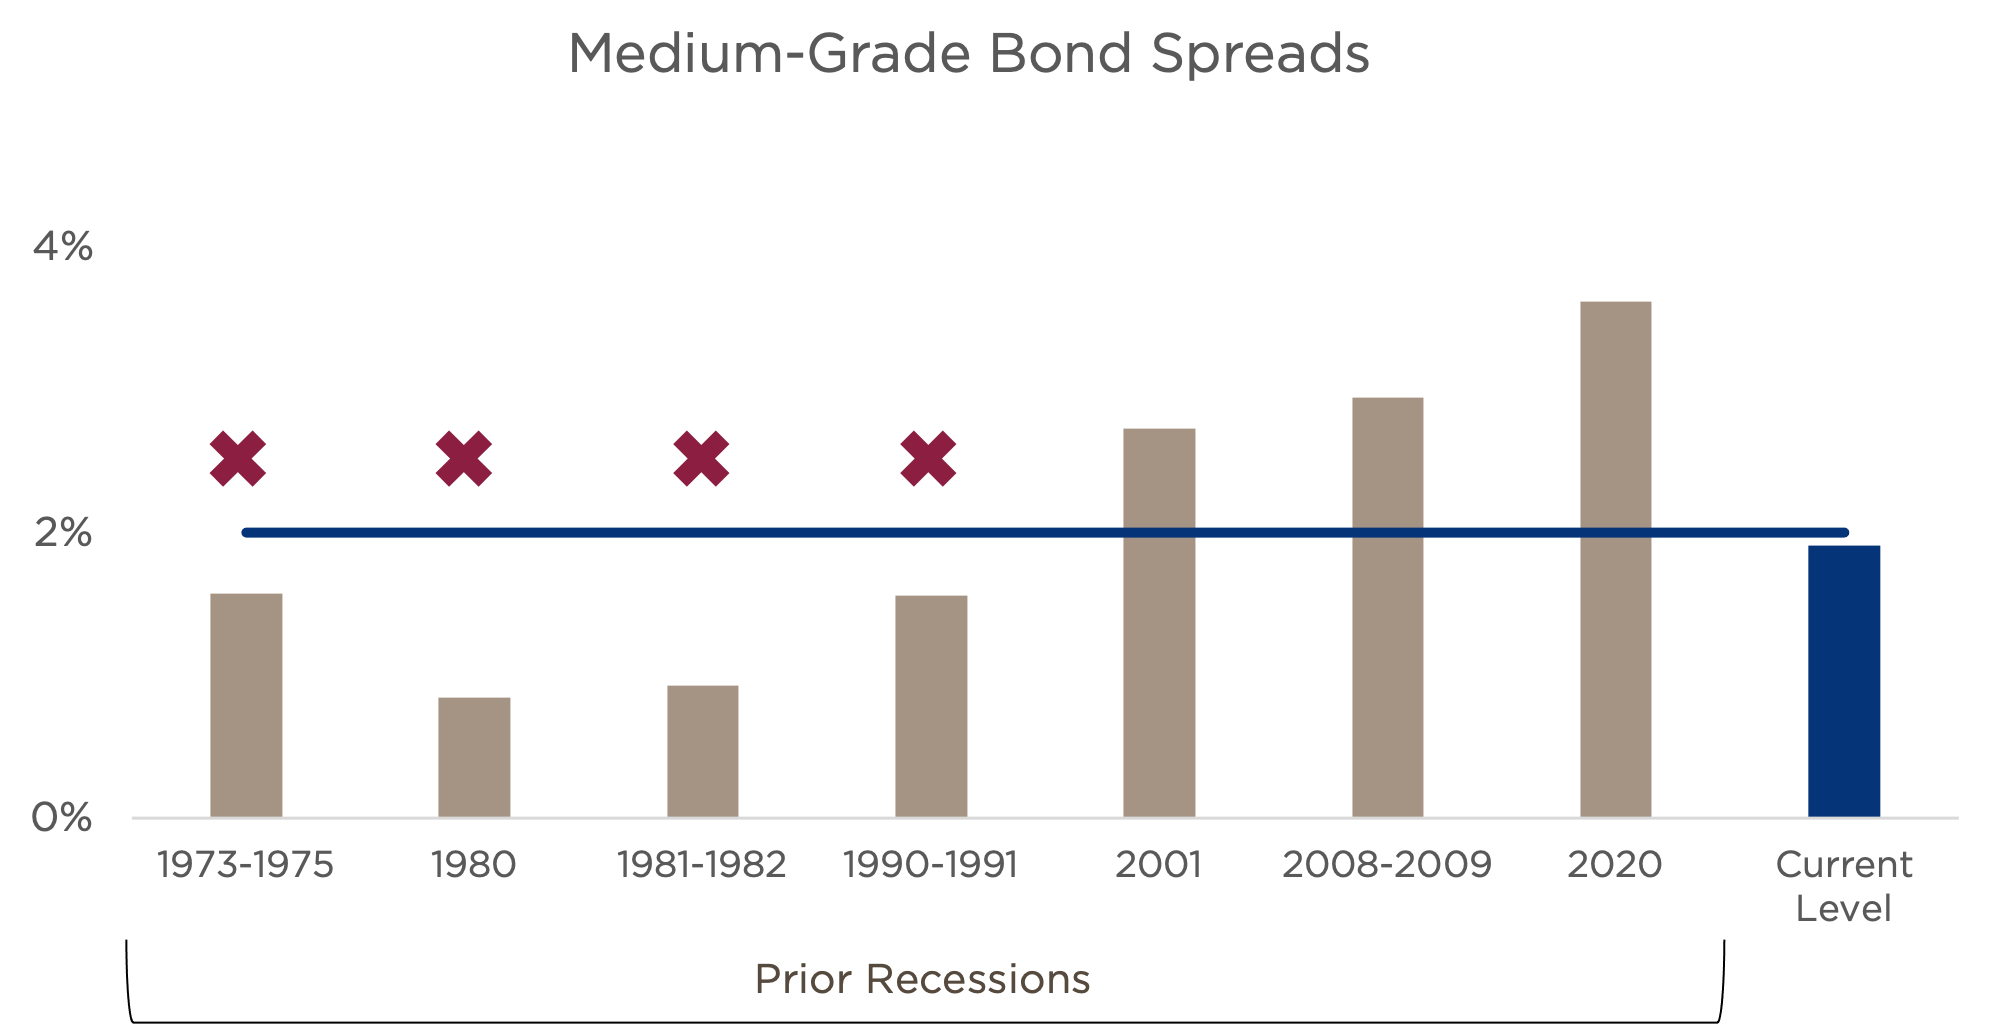
Sources: Bloomberg, CAPTRUST Research
Credit spreads reflect the amount of excess compensation that investors demand for assuming the higher credit risk of lower-rated bonds. Rising spreads indicate more concern about business fundamentals and credit conditions. Current levels are elevated but are shy of the 2 percent threshold.
Three Common Always Shortcuts
1. U.S. recessions have always been preceded by an inverted yield curve.
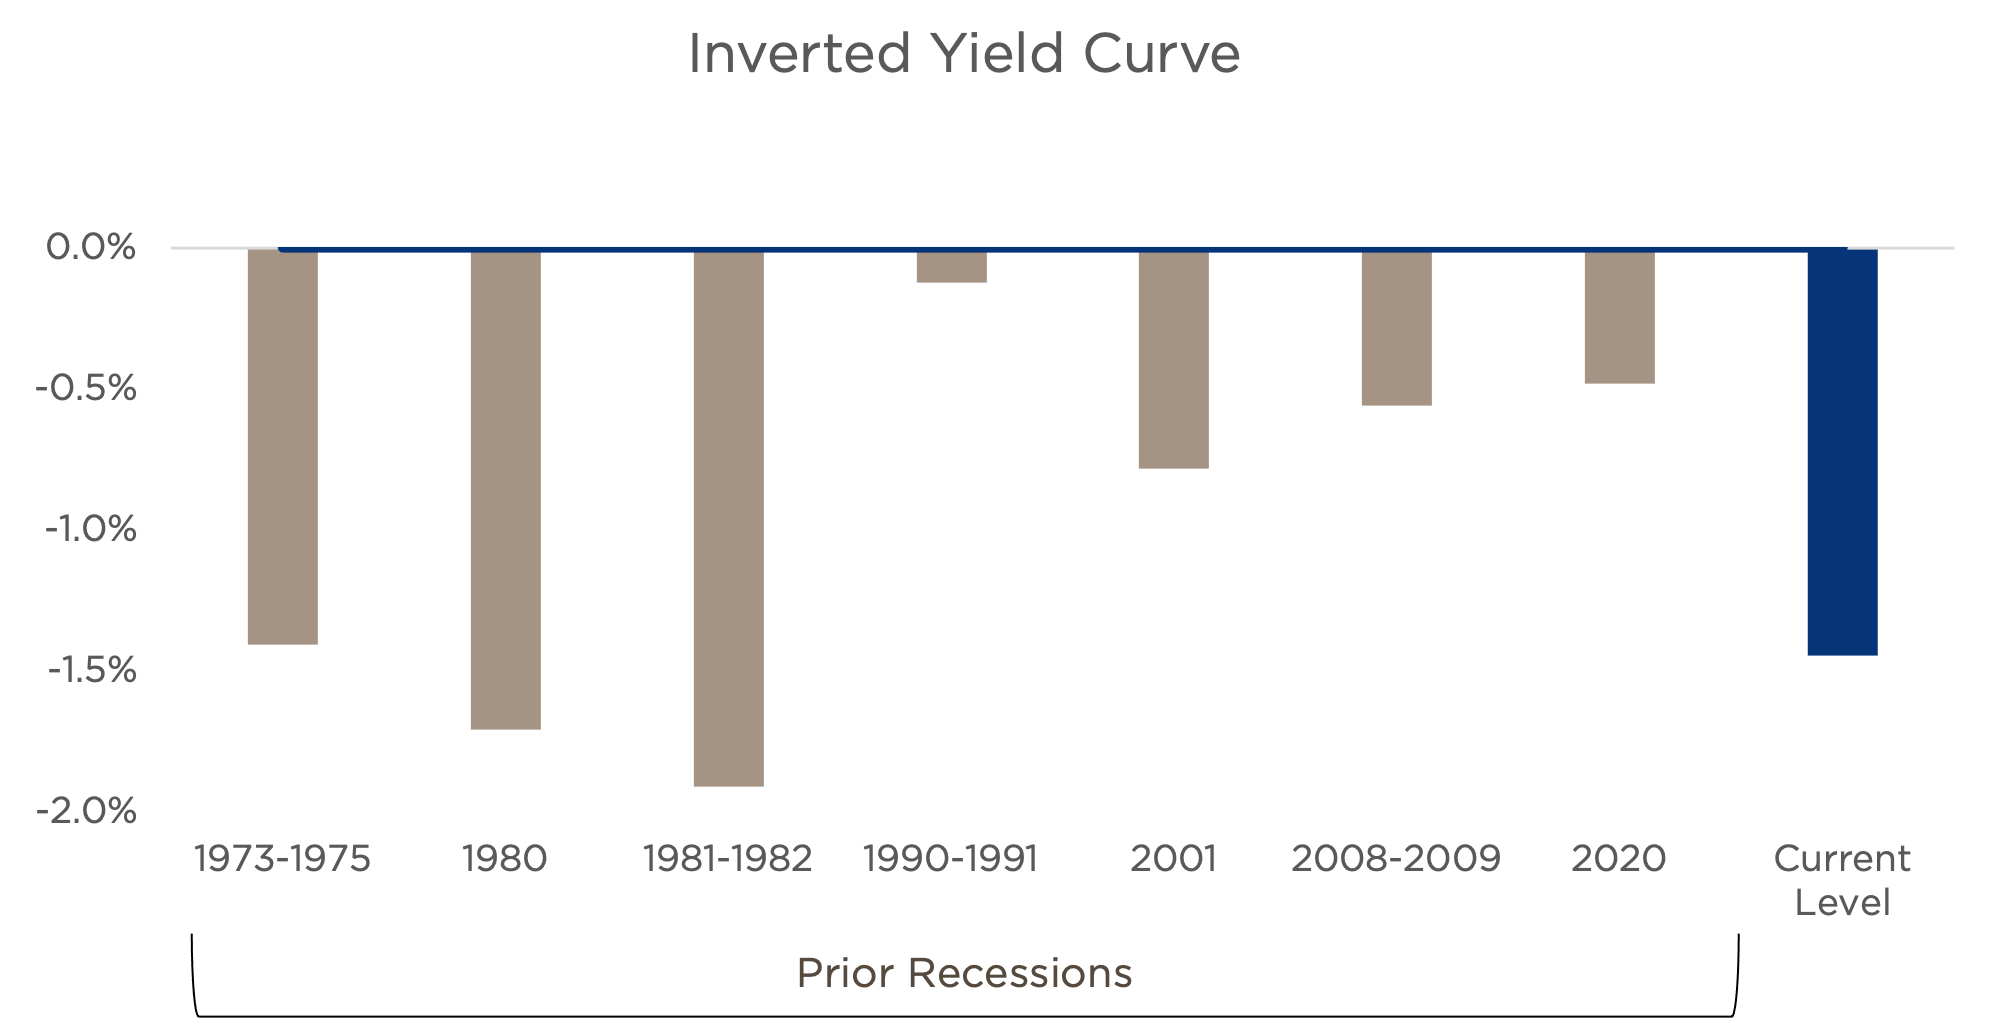
Sources: Bloomberg, CAPTRUST Research
An inverted yield curve occurs when the yield on shorter-maturity Treasurys exceeds that of longer-maturity bonds. Normally, investors demand higher yields from longer-maturity bonds because of the risks of inflation and economic slowdown when measured over longer time periods. When the yield curve inverts, and shorter-maturity bonds offer higher yields than longer-term bonds, this signals that investors anticipate weaker economic conditions in the near-term. The chart above shows the 10-year Treasury yield minus that of the three-month Treasury, suggesting a steeply inverted yield curve at present.
2. The economy has always entered a recession when leading economic indicators decline at 5 percent or more, year over year.
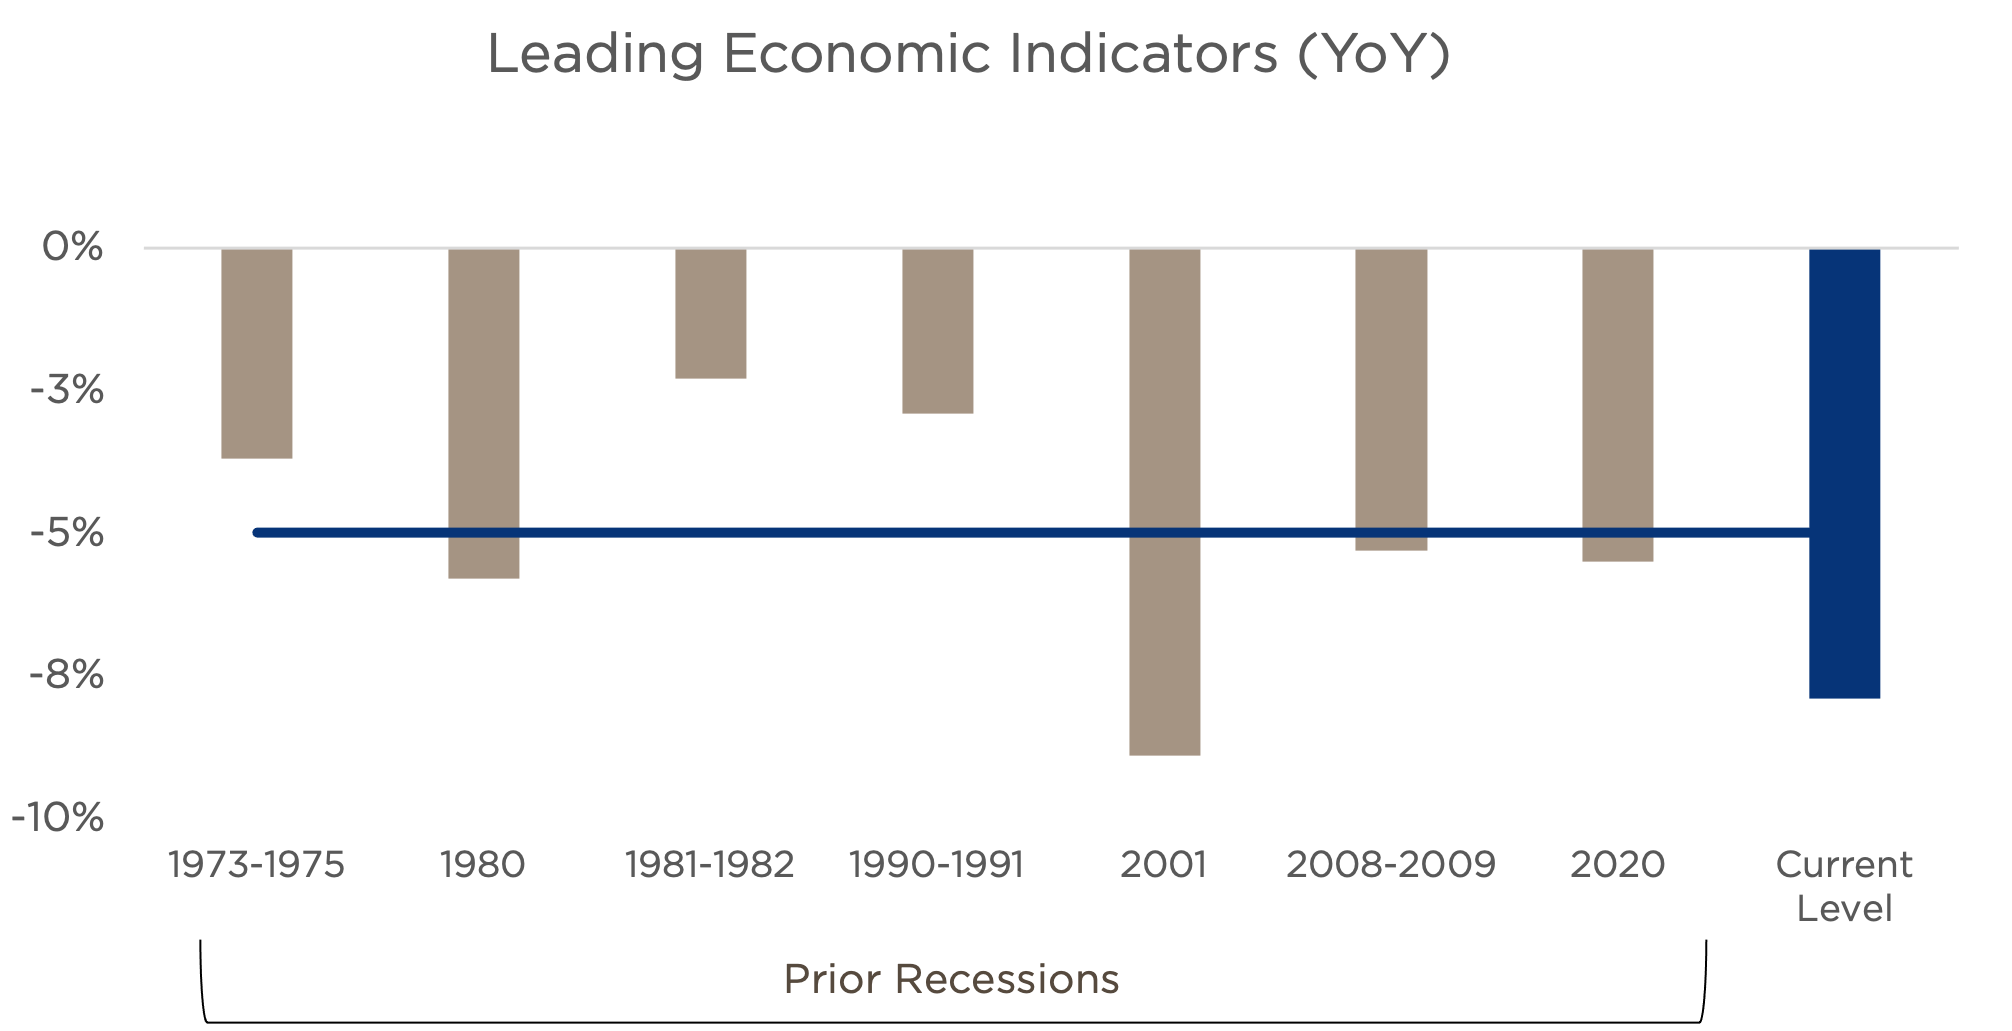
Source: Bloomberg, CAPTRUST Research
The index of leading economic indicators is intended to forecast the future direction of the economy over the next six months, based on 10 underlying factors. This includes manufacturing, building permits, market data, and the confidence levels of consumers and businesses. Current levels reflect a weakening economic forecast.
3. A recession has always occurred when year-over-year headline inflation is more than 5 percent.
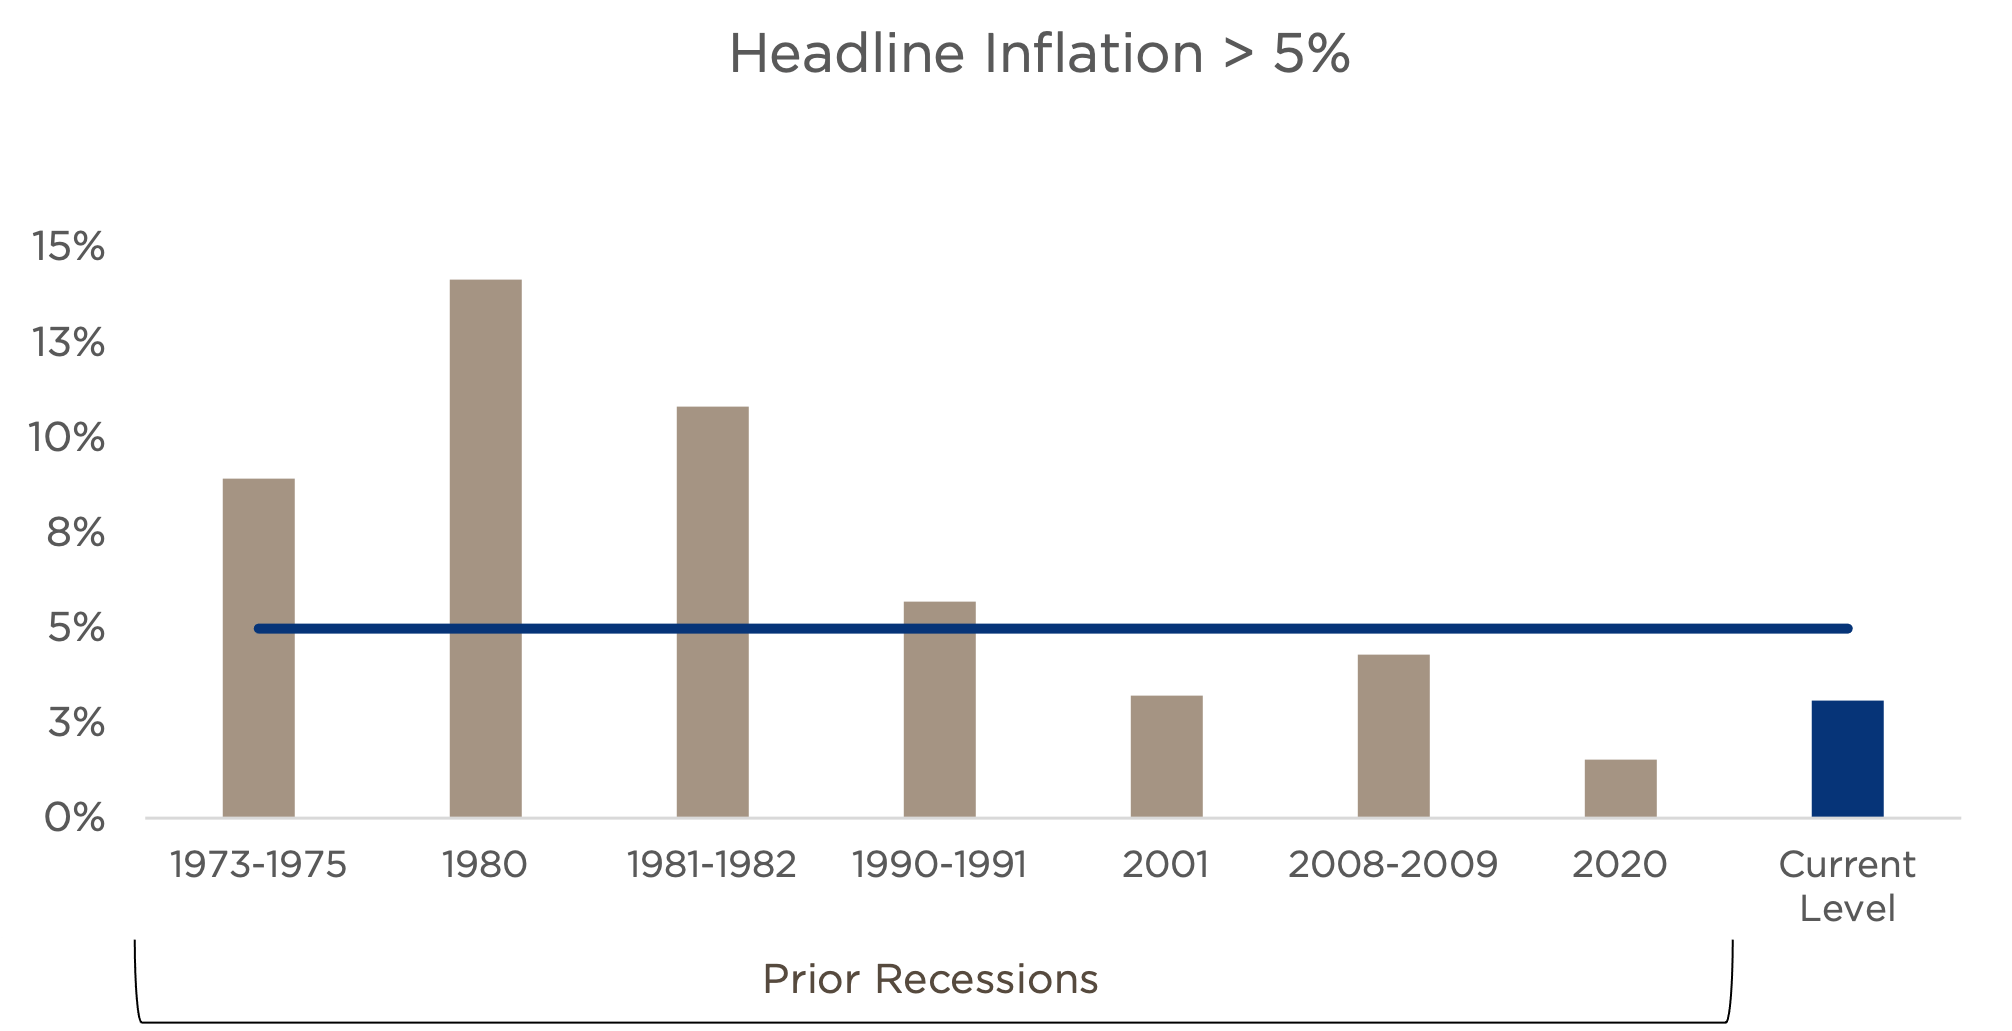
Source: U.S. Bureau of Labor Statistics, Federal Reserve Bank of St. Louis, CAPTRUST Research
High levels of inflation inflict pain on the economy through both their symptoms and their cure. Although the level of year-over-year price inflation peaked a year ago at nearly 9 percent, it has since declined to just above 3 percent.
As these charts illustrate, few heuristics are foolproof. The two most reliable are the first never and the first always: the strength of the labor market and the inversion of the yield curve. Historically, each of these has demonstrated a high degree of accuracy. But with the unemployment rate currently lower than 4 percent (thereby indicating a low probability of recession) and the yield curve demonstrating an extreme level of inversion (thereby indicating a high probability of recession), the question is which will be correct?
These two rules stand in stark opposition to one another, representing just two of many mixed signals that we are seeing in today’s economy.
Mixed Signals
Investors now face an uncertain mixture of data that may point to a positive outcome—that is, an economic soft landing without recession—despite high levels of inflation and aggressive action by the Federal Reserve to combat it. However, the economy still faces significant headwinds that could lead to a less rosy outcome.
On the positive side of the ledger, we continue to see an abnormally strong labor market, with the lowest unemployment rate since the 1960s. This strength has contributed to robust wage growth, with incomes growing faster than at any point in the past 25 years.1 Encouraged by plentiful jobs and larger paychecks, consumers continue to spend freely. Although we’ve seen excess savings from the pandemic start to shrink and credit card balances grow, strong wages have kept the registers ringing.
In addition, we’ve seen some of the policy and systemic risks from earlier in the year resolve. The stress in the banking sector that emerged in late March has been largely contained, and the debt ceiling showdown reached a successful conclusion, or at least was put on pause until later.
Another positive contributor is emerging AI technology, which has captured the imagination of investors and reinvigorated corporations with the promise that these new tools could increase productivity while also providing service and revenue enhancements.
That said, it is also important to acknowledge the remaining challenges facing the economy through the rest of the year. As interest rates continue to rise, the cost of capital increases, affecting consumers, corporations, and governments alike while also potentially suppressing profitability. Although many companies refinanced debt at near-zero interest rates in 2020, these benefits may be short-lived, since nearly $3.5 trillion in corporate debt is set to mature by 2024.2 The government also faces rising interest expense on government debt, pressuring the budget and potentially forcing austerity measures.
Along with raising interest rates, another potent monetary policy tool the Fed has in its pocket is shrinking the size of its balance sheet, a maneuver known as quantitative tightening. The result of these policies is a reduction in the overall supply of money in the system, reducing the amount of liquid assets that are readily available for spending or investment.
Always Uncertain
Despite the challenges, dire headlines, and widespread predictions of recession, equity returns for the first half of 2023 have been impressive. Although most of the gains are concentrated in a relatively small number of stocks, we have seen gains begin to broaden out to a wider swath of the equity market over the past few months. Market leadership may no longer be condensed to only the largest mega-cap tech stocks, a positive sign for continued strength.
However, in the always-unpredictable terrain of the stock market and economy, like Sean Connery, we should never say never. The ability to adapt, question assumptions, and balance opposing signals is essential for investors. By staying attuned to both risks and opportunities, investors can navigate the complexities of the market and achieve their financial goals.
Although many of the risks that were present earlier this year have begun to abate, we remain cautious, with a strong belief that nothing should be taken for granted. Economic signals may be shaken, but given the strong returns so far this year, it appears investor optimism has been stirred.
1 Federal Reserve Bank of Atlanta, Wage Growth Tracker
2 Dealogic, CAPTRUST Research